
Funnels
Where people fall out of onboarding, checkout or any other sequence, with conversion windows you can set in hours or weeks and segment on any warehouse column.
Warehouse-native product analytics
Beacon runs funnels, retention and cohort analysis directly against Snowflake, BigQuery or Redshift. There is no second copy of your event data, no separate SDK to instrument, and no invoice that scales with how many events your product happens to emit this quarter.

0
Copies of your event data we store
1.4 s
Median funnel query, 200M-event table
380+
Product teams, from 6 to 6,000 people
Per seat
Pricing, not per event — see below
What it does
Beacon compiles every view into SQL against your warehouse and shows you the query it ran. A product manager gets an answer in a minute; the analyst who has to defend the number gets a query they can read.
Where people fall out of onboarding, checkout or any other sequence, with conversion windows you can set in hours or weeks and segment on any warehouse column.

Classic and unbounded retention, weekly or monthly cohorts, and the one view most teams actually need: which behaviour in week one predicts still being here in week twelve.

Every chart has a “show the query” button. Copy it into your own editor, check the join, and argue with it. Analytics you cannot audit is analytics nobody trusts twice.
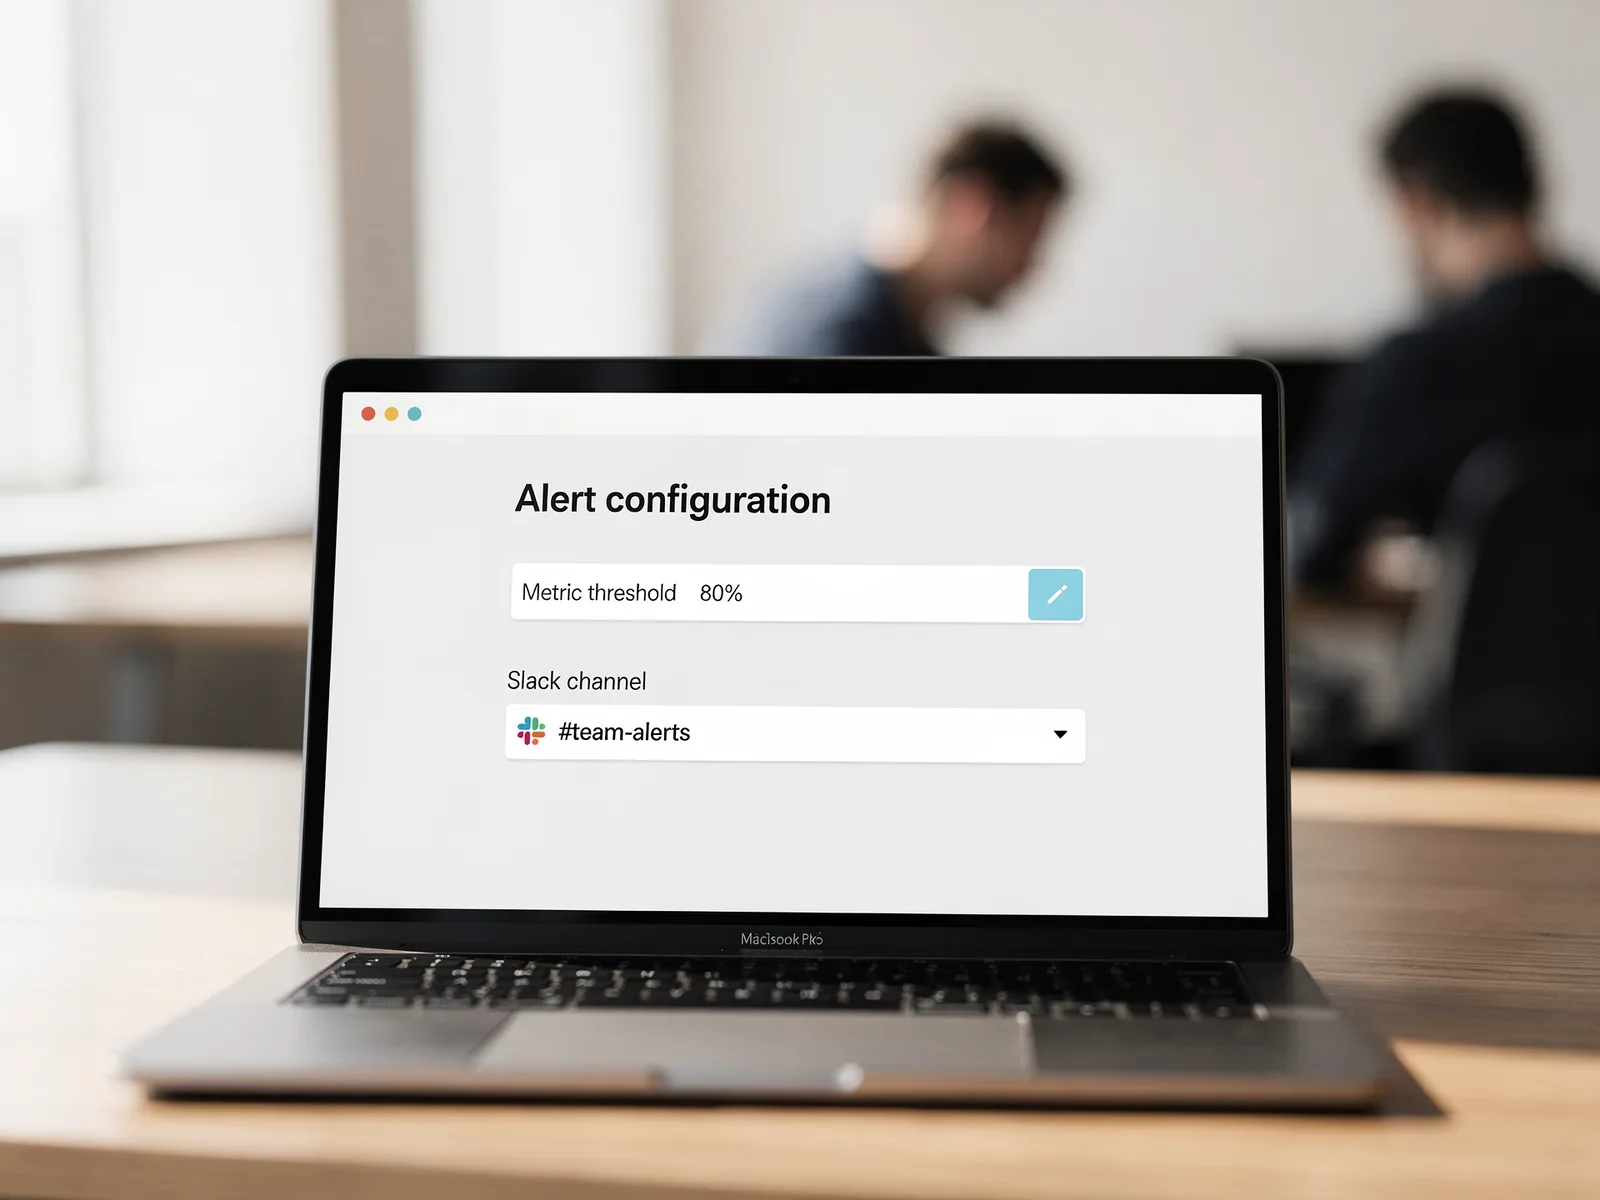
Threshold and anomaly alerts on any saved metric, delivered to Slack or email. Built on the same compiled queries, so an alert can never disagree with the chart it came from.
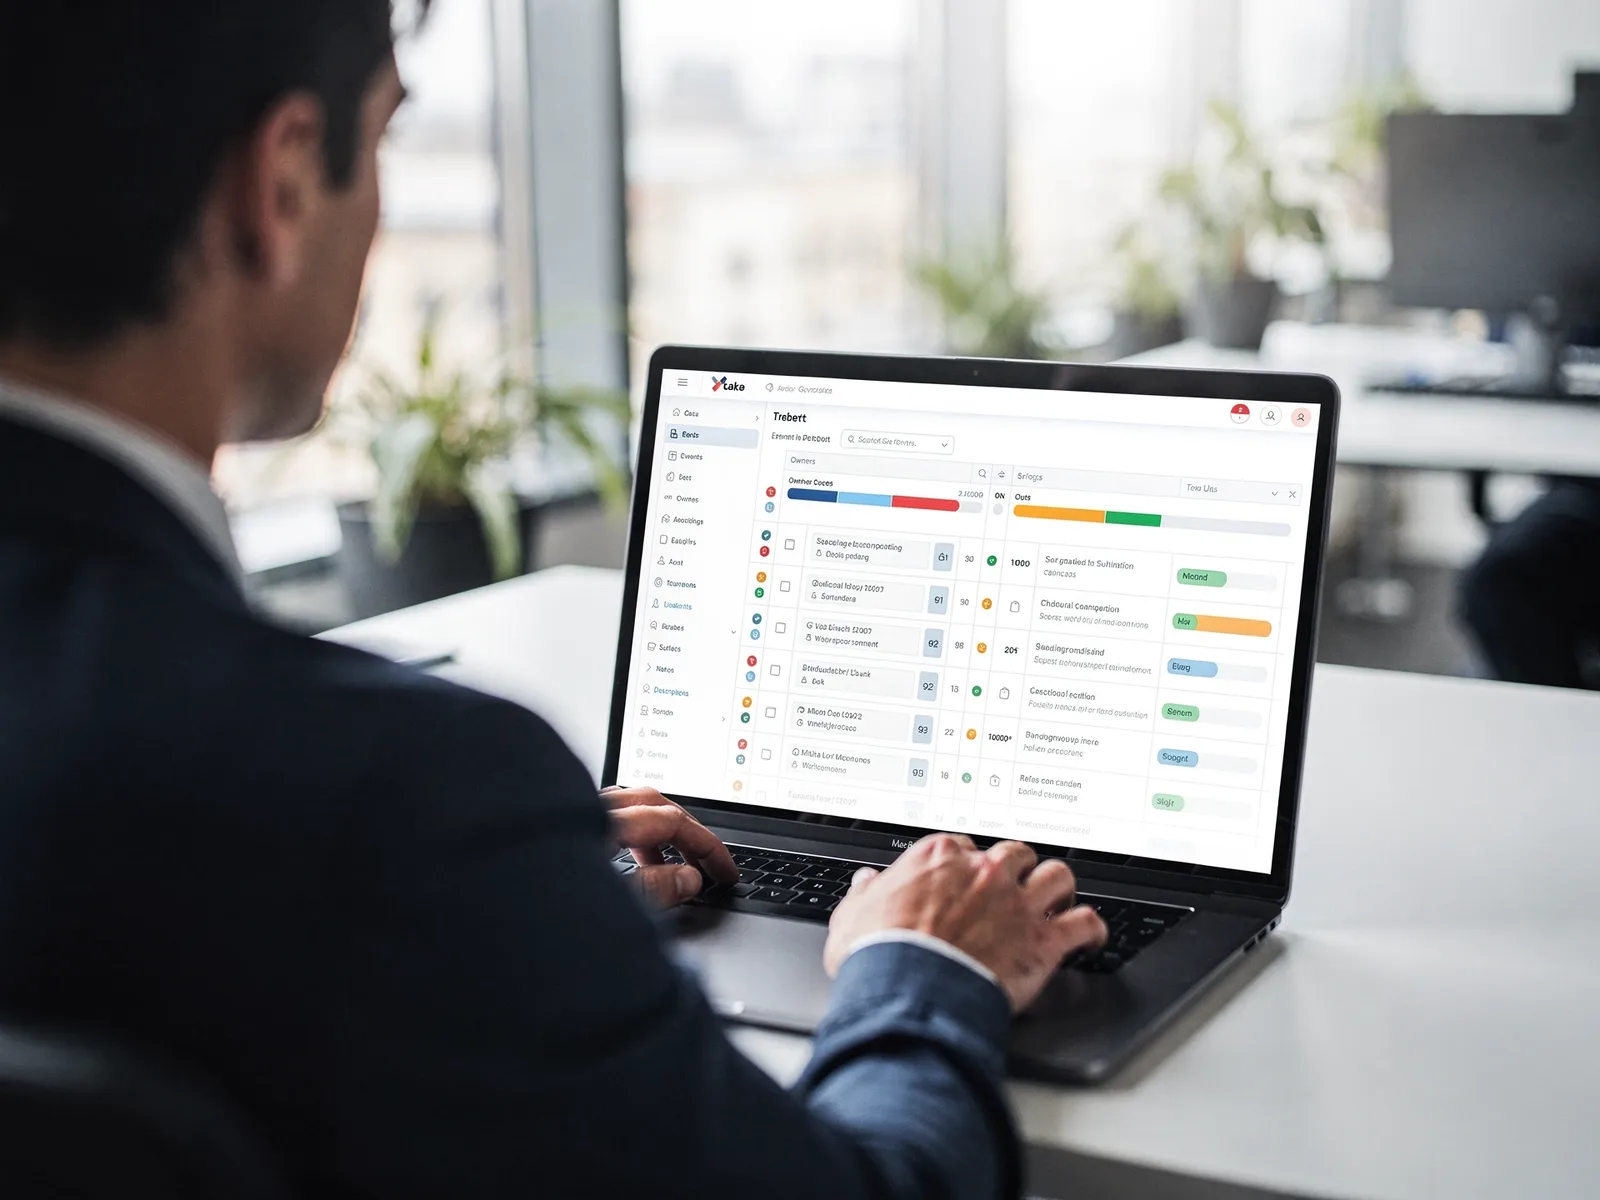
A single definition per event and metric, owned by a named person, with deprecations that actually propagate. This is the feature that stops three dashboards reporting three different signup counts.

Beacon queries as the role you give it, so row-level security you have already built in Snowflake or BigQuery keeps working. No second permissions model to drift out of sync.
Who it is not for

“We killed a $340k contract with an event-based vendor and replaced it with Beacon and about nine days of dbt work. The number that convinced finance was not the licence cost — it was that we stopped paying to store the same events twice.”— Dee Okafor, VP Data · a 900-person fintech